



Most businesses assume their SEO problems come down to keywords, backlinks, or content. So they keep publishing, keep optimising, and keep wondering why the results aren’t moving. What they’re not checking is that Google has been quietly scoring them the whole time: how their website actually performs when a real person lands on it. In 2026, that score is directly tied to your rankings.
Here’s what Core Web Vitals actually measure, why they matter more now than they ever have, and where to focus your attention first.
What Core Web Vitals Actually Are
Core Web Vitals are Google’s set of performance metrics that measure the real-world experience of using a website. Not a simulated lab test, but how actual visitors on actual devices experience your pages.
There are three metrics at the centre of it:
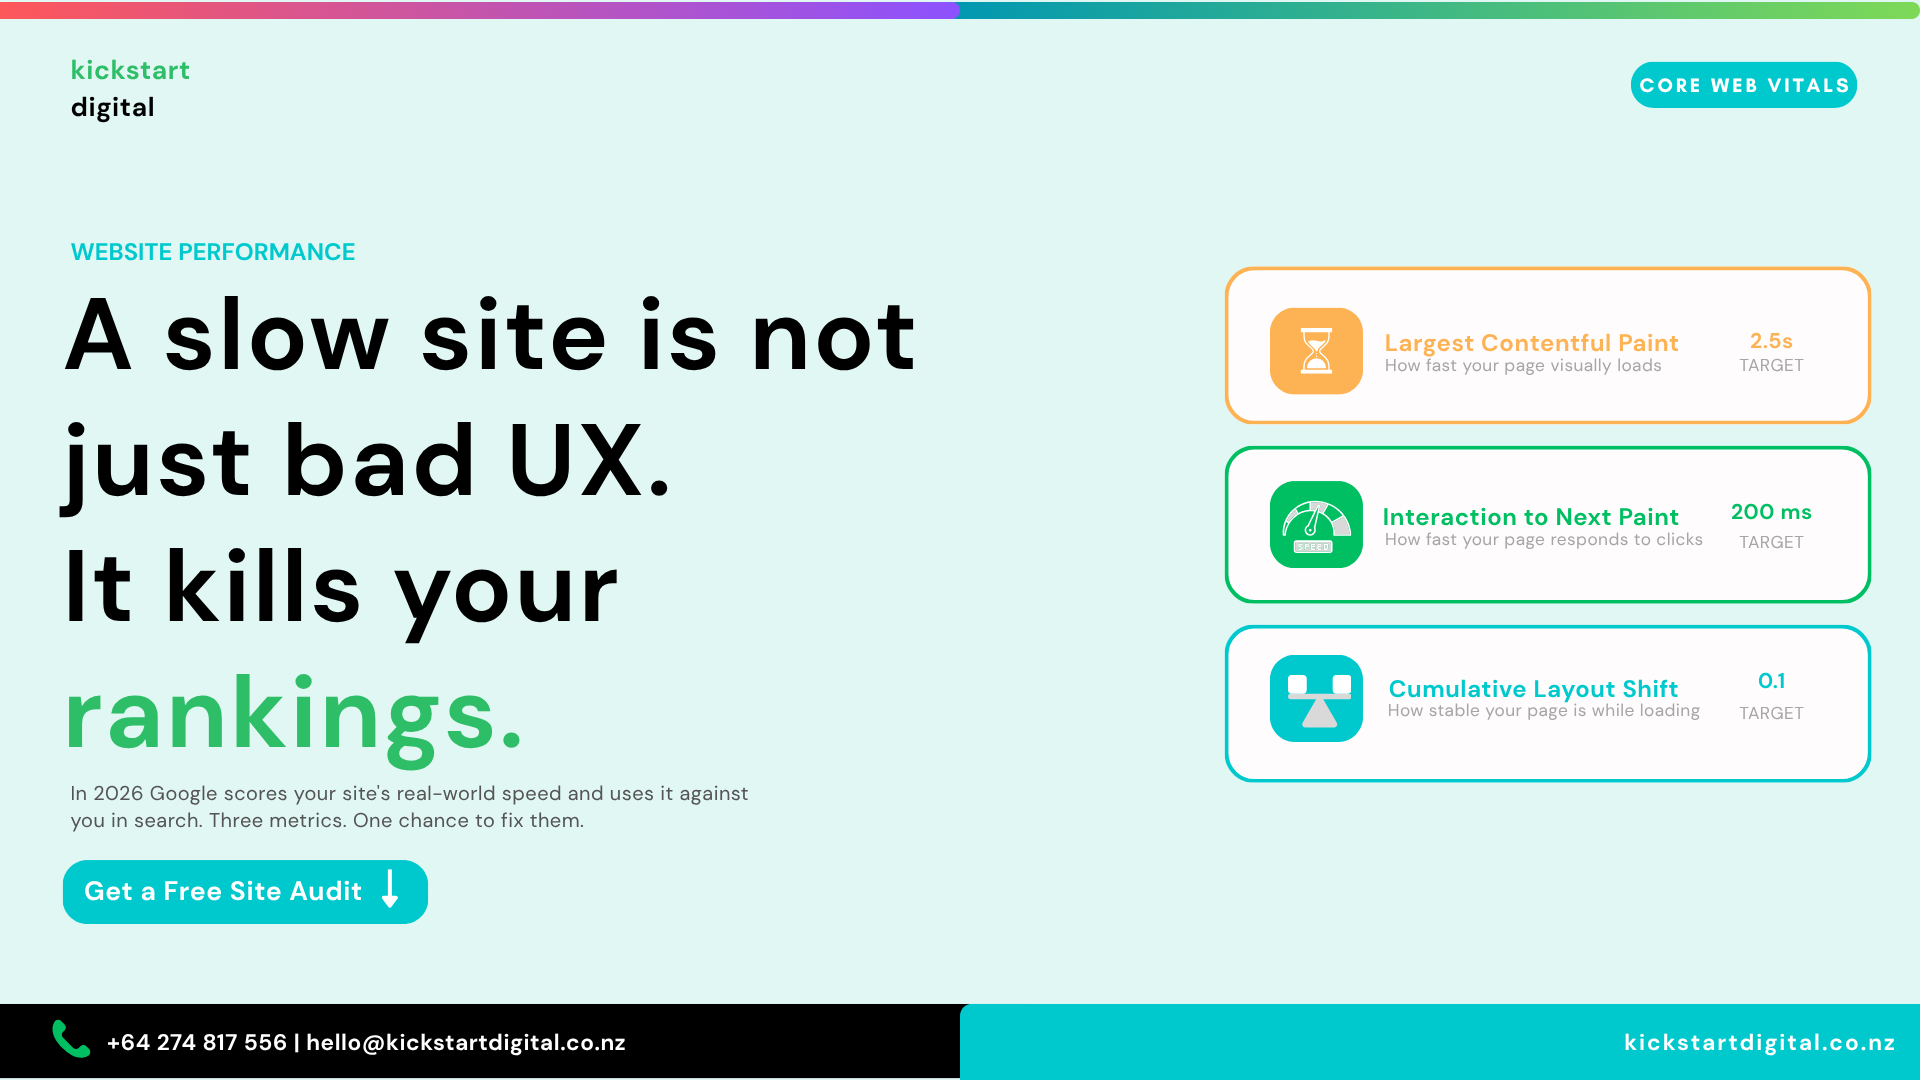
Largest Contentful Paint (LCP) measures how long it takes for the biggest visible element on the page (usually a hero image or main headline) to load fully. Google wants this under 2.5 seconds. Beyond that, you’re in “needs improvement” territory. Over four seconds is considered poor.
Interaction to Next Paint (INP) replaced an older metric in 2024 and is now the trickier one for most sites. It measures how quickly your page responds every time a user clicks, taps, or types, and takes the worst interaction across the whole session. Google’s threshold is under 200 milliseconds. This one catches a lot of sites off guard, particularly those running WordPress with a lot of plugins or heavy third-party scripts.
Cumulative Layout Shift (CLS) tracks visual instability. That moment when you’re about to tap a button, and the page jumps, so you tap an ad instead. Or when text shifts as an image loads. Google wants a CLS score under 0.1. Higher than that, and visitors are having a disjointed experience, even if they can’t name what’s wrong.
These aren’t just technical numbers sitting in a dashboard somewhere. They feed directly into how Google evaluates your pages against competing results.
Why This Matters More in 2026
Core Web Vitals have been a ranking signal for a few years now, but the weight they carry has shifted. Google has been progressively tightening its performance expectations, and the introduction of INP in 2024 alone pushed a significant number of previously “passing” sites into failing territory.
The other shift is what’s happening around search results themselves. Google’s AI-powered features are increasingly surfacing content directly in search, and the pages it draws from tend to be fast, stable, and well-structured. A slow site doesn’t just rank lower in traditional results. It’s also less likely to be featured in the AI summaries that are taking up more real estate on the search page.
At Kickstart Digital, we’ve been working with businesses on website development in Auckland long enough to see what happens when performance is treated as an afterthought versus when it’s built in from the start. The difference in long-term search visibility is significant.
The UX Connection Google Actually Measures
Google uses real browsing data from Chrome users to build a picture of how people interact with your site. If visitors are landing and bouncing straight back to search results, that’s a signal that they’re scrolling without engaging or rage-clicking on elements that aren’t responding, which feeds into how Google evaluates the overall quality of the page.
This is what makes Core Web Vitals part of a broader story, not just a technical checklist. A site that passes the three metrics technically but still has confusing navigation, unclear page structure, or a poor mobile layout is still going to leak engagement signals that hurt its ranking potential.
The businesses that hold up well through Google’s updates aren’t necessarily the ones with the highest page speed scores. They’re the ones where the whole experience hangs together: fast load, clear layout, easy to navigate, and works properly on mobile.
Mobile Performance Is Where Most Sites Fall Over
If you’re testing your website on a laptop connected to your office broadband, you’re not seeing what most of your visitors see. The majority of web traffic in New Zealand comes from mobile devices, often over cellular connections, which perform very differently from fixed broadband lines.
A page that loads in 1.5 seconds on a desktop might take four or five seconds on a mid-range phone on a 4G connection. Google’s performance data is measured on simulated mobile conditions, not your best-case desktop experience. That gap matters enormously.
Mobile usability also goes beyond speed. Buttons that are too small to tap, text that requires zooming, and navigation that doesn’t adapt to a smaller screen. These friction points reduce engagement, and reduced engagement feeds back into search performance over time. The technical score is one thing. How a real person navigates your site on their phone is another.
What’s Dragging Most Sites Down
After working with a range of client sites across industries, a few culprits recur.
Images that haven’t been optimised. A hero image saved as a large JPEG and uploaded without resizing or compression is one of the most common LCP killers. Converting images to modern formats, serving the right size for the device, and making sure the main image starts loading immediately rather than being delayed by other resources can make a material difference to load time.
Too many scripts are running on every page. Third-party tools like chat widgets, analytics platforms, advertising pixels, and marketing automation scripts all add to the work the browser has to do. When several of these load at once and compete for processing time, INP suffers. Users click something, and the page freezes for a beat before responding. That beat is what Google is measuring.
Dynamic content that loads without reserved space. Banners, ads, or blocks of content that load in after the initial render and push everything else down the page. This is the main driver of poor CLS scores, and it’s often straightforward to fix by reserving space in the layout before the content arrives.
Hosting that can’t keep up. Before any frontend optimisation can take effect, the server needs to respond quickly. Shared hosting environments where your site competes for resources with dozens of others often produce slow server response times that put a ceiling on everything else. This is one of the less glamorous factors in search performance, but it’s foundational.
For businesses looking at this seriously, SEO in Auckland needs to account for technical performance, not just content and keywords. They’re not separate conversations anymore.
How to Read Your Own Performance Data
You don’t need a developer to get started. Google Search Console has a Core Web Vitals report under the “Experience” section showing real-world field data drawn from actual Chrome users, which is more useful than any lab test. PageSpeed Insights gives you both lab and field data for any URL, along with a prioritised list of what’s causing the most drag.
When you look at the results, focus on pages in “Poor” or “Needs Improvement” status and whether the issues are spread across the site or concentrated on specific page types. High-traffic pages in poor shape are the logical place to start.
We help clients track this as part of growth tracking and reporting, because changes in technical performance often show up in rankings weeks before or after, and having the data side by side makes it easier to understand what’s actually driving movement.
Performance Is Now a Ranking Conversation
Website speed has always been a factor in user experience. What’s changed is that Google now has the tools and data to measure experience at scale and factor it directly into rankings in a way that’s harder to offset with other signals.
Content quality still matters. Links still matter. But when two pages are competing for the same query and one loads in under two seconds on mobile while the other takes five, the faster page wins that tiebreak. And in competitive markets, tiebreaks happen constantly.
If you haven’t looked at your Core Web Vitals in a while, now is a reasonable time to pull the data and see where things stand. The fixes aren’t always quick, but the clearer picture of what’s dragging your performance down is genuinely useful, regardless of what you decide to do about it.